
Unity ECS Performance Testing: The Way To The Best Performance
This is the next part of the series that started with the previous post on how to write unit tests for Unity ECS. Today, we’ll extend the sample with performance tests to measure the performance of any system and make sound decisions when optimizing it. Given the broad range of approaches to achieve the same task with Unity.Entities, performance testing helped me a lot. It guided me in choosing the methods that run the fastest in my particular case.
For my game and this tutorial, I am using Unity 2022.3.9f1, Unity.Entities 1.0, and Performance Testing 3.0.3.
The series:
Contents:
Why Do We Need Performance Testing With Unity ECS
1. There are a lot of developers like me, who were not using Unity.Entities until the 1.0 release due to ever-changing API. Even though there were a lot of breaking changes, I got the feeling that the release API suffers from having too many methods that provide the same functionality and were added in different versions (e.g. iteration over entities can be done in various ways and some are inferior to newer implementations).
In my observation, those who have used Entities for an extended period across various versions are familiar with the approaches to use, drawing from their experience and understanding of Entities’ development history. But most of us don’t have access to ask every question to such people. Performance testing allows us to quickly compare multiple approaches and make a sound decision about which one to choose.
2. Some stuff in ECS can be run in parallel by using the Job System. However, scheduling work on worker threads has overhead. But generally, you can not tell for sure whether your particular code with a particular amount of entities in your game performs better on the main thread or in parallel until you profile it (unless you have thousands of entities matching the filter, in that case, I bet parallelization would yield better results).
Profiling is a great tool, but you usually take only one sample as it’s pretty time-consuming. In most cases, it might be enough, when the difference is significant. But what if the difference is pretty small? Then you cannot tell what’s faster with absolute certainty, as the difference might be caused by other apps running on a device during profiling, or thermal throttling after multiple profiling sessions causes the performance dip. That’s where the benchmark comes in. With performance testing, we can run a system’s Update() many times in isolation, including prewarm, and observe the median result. Given that we can make better decisions with higher precision.
3. Performance tests are part of our automated testing suite. It means we can run it with almost no effort for each build or after each change when you are trying to optimize any system. I’m saying almost because running tests anyway takes time on your machine or a build agent, but this time is a fraction of what you would spend if you used profiling for tracking performance metrics for each build or after each optimization attempt.
4. In minor updates they still optimize code generation and code under the hood, so some methods become faster. With performance tests, we can quickly add one more test case and test this optimization in our code to decide whether to use it or not right now.
Setup
First of all, we should add the Performance Testing package. I have a post on how to do it. In previous versions, it had some critical issues and I shared in my post ways to solve them. But the latest version based on my observations works a lot better and the setup is very straightforward.
All tests are performed on a target device, which is a PC with the following specs:
13th Gen Intel(R) Core(TM) i7-13700KF   3.40 GHz
GeForce RTX 4070 Ti
It’s another significant point, that all tests are running not in the editor, but on a real device with no editor overhead.
Let’s also extend the CustomEcsTestFixture.cs from the previous post to simplify API to measure the Update():
public class PerformanceEcsTestsFixture : CustomEcsTestsFixture
{
    private readonly SampleGroup _sampleGroup = new("Time", SampleUnit.Microsecond);
    private const int WarmupCount = 5;
    private const int MeasurementCount = 10;
    private const int IterationsPerMeasurement = 5;

    /// <summary>
    /// Measures the Update of system of type T with entities containing components of passed types
    /// </summary>
    /// <param name="types">components added to entities</param>
    /// <typeparam name="T">System's under test type</typeparam>
    /// <returns></returns>
    protected void MeasureUpdate<T>(params ComponentType[] types) where T : unmanaged, ISystem
    {
        Measure.Method(UpdateSystem<T>)
            .SetUp(() =>
        {
            CreateSystem<T>();
            CreateEntities(types);
        })
        .WarmupCount(WarmupCount)
            .MeasurementCount(MeasurementCount)
            .IterationsPerMeasurement(IterationsPerMeasurement)
            .SampleGroup(_sampleGroup)
            .Run();
    }

    protected void MeasureUpdate<T>(int entityCount, params ComponentType[] types) where T : unmanaged, ISystem
    {
        Measure.Method(UpdateSystem<T>)
            .SetUp(() =>
        {
            CreateSystem<T>();
            CreateEntities(types, entityCount);
        })
        .WarmupCount(WarmupCount)
            .MeasurementCount(MeasurementCount)
            .IterationsPerMeasurement(IterationsPerMeasurement)
            .SampleGroup(_sampleGroup)
            .Run();
    }
}
When I want to test something, I either create two systems stripped of unnecessary details in the test assembly and run the test against them, or I use the real system from the game core assembly and create its copy in the test assembly with the required changes. That way it is not included in the build and I can have it all the time there to test the performance after ECS updates or changes to my code.
Writing Performance Tests
I started by checking the performance of the following stuff:
EntityManager.HasComponent()/GetComponent()vsSystemAPI.HasComponent()/GetComponent()- A system running update on the main thread vs
job.Run()vsjob.Schedule()vsjob.ScheduleParallel()given the number of entities matching the filter. With this test, I could select the right implementation later if I increased or decreased this number significantly based on design changes.
EntityManager.HasComponent() vs SystemAPI.HasComponent()
I simplified the system to eliminate any code that is redundant for the current case and just left what I wanted to test:
[BurstCompile]
public void OnUpdate(ref SystemState state)
{
    foreach (var (_, _, entity) in
             SystemAPI
                 .Query<MovementStatsData, RefRW<MovementDirectionData>>()
        .WithAll<GravityTag>()
        .WithEntityAccess())
    {
        if (state.EntityManager.HasComponent<MovementStatsData>(entity))
        {
            if (state.EntityManager.GetComponentData<MovementStatsData>(entity).Gravity > 0)
            {
            }
        }
    }
}
[BurstCompile]
public void OnUpdate(ref SystemState state)
{
    foreach (var (_, _, entity) in
             SystemAPI
                 .Query<MovementStatsData, RefRW<MovementDirectionData>>()
        .WithAll<GravityTag>()
        .WithEntityAccess())
    {
        if (SystemAPI.HasComponent<MovementStatsData>(entity))
        {
            if (SystemAPI.GetComponent<MovementStatsData>(entity).Gravity > 0)
            {
            }
        }
    }
}
To make sure this test makes sense let’s look at the generated code. When using EntityManager, basically, nothing has changed:
// Code generation when using EntityManager
if (state.EntityManager.HasComponent<GroundCollision>(entity))
{
    if (state.EntityManager.GetComponentData<MovementStatsData>(entity).Gravity > 0)
    {
    }
}
And when using SystemAPI:
// Code generation when using SystemAPI
if (__TypeHandle.__Roguelite_Movement_MovementStatsData_RO_ComponentLookup.HasComponent(entity))
{
    state.EntityManager.CompleteDependencyBeforeRO<global::Roguelite.Movement.MovementStatsData>();
    __TypeHandle.__Roguelite_Movement_MovementStatsData_RO_ComponentLookup.Update(ref state);
    if (__TypeHandle.__Roguelite_Movement_MovementStatsData_RO_ComponentLookup[entity].Gravity > 0)
    {
    }
}
So the second version uses ComponentLookup, so it’s interesting to see which one is faster.
Now, let’s examine the results with the default entity count of 1000:
|                         Method |     Median |      Dev |     StdDev |
|--------------------------------|-----------:|---------:|-----------:|
| EntityManagerHasComponentTest  | 431,85 μs  | 0,29 μs  | 123,09 μs  |
| SystemApiHasComponentTest      | 533,05 μs  | 0,39 μs  | 208,12 μs  |
So SystemAPI is 23% slower in that case, both operations are still very fast though (timings are in microseconds), so probably you don’t need to rush changing all usages of SystemAPI to EntityManager, but you definitely can keep in mind this implementation detail as you might have a lot of such calls each Update and this number would be growing.
Jobs Performance
Next, let’s see if jobifying my system gives any boost. The system itself is the simplest one – it resets the movement data at the end of the simulation group:
[UpdateInGroup(typeof(FixedStepSimulationSystemGroup))]
[BurstCompile]
public partial struct ResetMovementSystem : ISystem
{
    [BurstCompile]
    public void OnCreate(ref SystemState state)
    {
        state.RequireForUpdate(SystemAPI
            .QueryBuilder()
            .WithAllRW<MovementDirectionData>()
            .Build());
    }

    [BurstCompile]
    public void OnUpdate(ref SystemState state)
    {
        foreach (var movementDirectionData in SystemAPI.Query<RefRW<MovementDirectionData>>())
        {
            movementDirectionData.ValueRW.Movement = default;
            movementDirectionData.ValueRW.HorizontalInput = default;
        }
    }
}
Let’s check how many entities we need in the game to make it worth running on worker threads. Again tests are running not in the editor, but on the target platform.
| TestName| Median| Average| StandardDeviation|
|----------------------------|-----------|--------------|--------------------|
| MainThread(1)| 2.95 μs| 3.07 μs| 0.75 μs|
| MainThread(10)| 3.10 μs| 3.22 μs| 0.76 μs|
| MainThread(100)| 3.85 μs| 10.33 μs| 10.59 μs|
| MainThread(1000)| 10.75 μs| 68.75 μs| 107.39 μs|
| MainThread(10000)| 25.10 μs| 626.16 μs| 1223.01 μs|
| MainThread(100000)| 82.45 μs| 7261.86 μs| 15478.04 μs|
|----------------------------|-----------|--------------|--------------------|
| RunJob(1)| 25.10 μs| 6224.81 μs| 14553.29 μs|
| RunJob(10)| 10.75 μs| 5447.14 μs| 13767.97 μs|
| RunJob(100)| 12.45 μs| 4843.27 μs| 13092.45 μs|
| RunJob(1000)| 16.35 μs| 4370.66 μs| 12501.26 μs|
| RunJob(10000)| 25.10 μs| 4146.36 μs| 11942.54 μs|
| RunJob(100000)| 43.60 μs| 6369.49 μs| 13827.61 μs|
|----------------------------|-----------|--------------|--------------------|
| ScheduleJob(1)| 25.10 μs| 5880.24 μs| 13392.81 μs|
| ScheduleJob(10)| 17.90 μs| 5461.38 μs| 12993.70 μs|
| ScheduleJob(100)| 16.45 μs| 5098.19 μs| 12626.45 μs|
| ScheduleJob(1000)| 17.70 μs| 4781.26 μs| 12286.97 μs|
| ScheduleJob(10000)| 20.25 μs| 4504.66 μs| 11971.35 μs|
| ScheduleJob(100000)| 22.50 μs| 4282.45 μs| 11670.12 μs|
|----------------------------|-----------|--------------|--------------------|
| ScheduleParallelJob(1)| 20.25 μs| 4057.58 μs| 11398.86 μs|
| ScheduleParallelJob(10)| 22.50 μs| 3856.46 μs| 11144.76 μs|
| ScheduleParallelJob(100)| 25.40 μs| 3675.97 μs| 10906.09 μs|
| ScheduleParallelJob(1000)| 30.70 μs| 3516.99 μs| 10680.23 μs|
| ScheduleParallelJob(10000)| 38.20 μs| 3388.08 μs| 10463.03 μs|
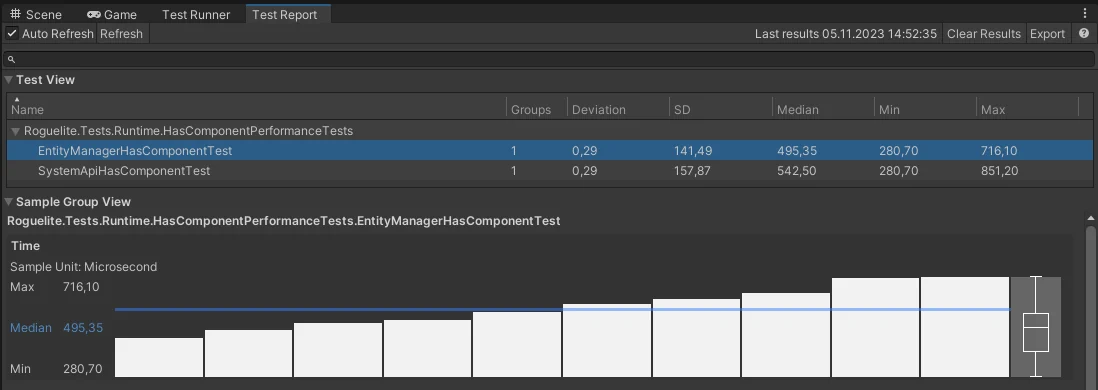
| ScheduleParallelJob(100000)| 57.10 μs| 3534.91 μs| 10275.74 μs|It’s worth noting that these results are less than ideal, the standard deviation signifies great dispersion of samples. For those interested, I’ve created a thread on the Unity forum explaining the reason behind the high dispersion. This is caused by samples being taken when a test seems to be idle, as every test includes numerous samples with a minimum time of 35 microseconds. Similarly, the maximum time is consistent for all tests except the main thread implementation. Here is a screenshot from another run; while the values differ slightly from those in the table above, it still illustrates the same point.

Nevertheless, it appears that this sampling with no actual work being done is distributed similarly across all tests. So with a grain of salt, we can assume that it still can be used to compare the performance of different implementations, but I would still profile the most critical parts until this issue is resolved and use what is available right now for less critical parts during the optimization process. Meanwhile, let’s hope the issue I raised in the thread will have input from Unity Technologies soon, and by the time you are reading my post, there is a fix or a workaround suggested.
It’s also worth mentioning that the first set of tests EntityManager vs SystemAPI has a pretty large deviation, but overall it looks a lot better, similar to the main thread version of ResetMovementSystem, so I believe the issue is only with ECS with Job System implementations:
Conclusion
Certain issues arise when measuring the performance of Unity ECS systems that utilize the job system. However, in my previous posts tests and results were perfectly fine when using the job system. So, performance tests still cover the majority of use cases in Unity and can be applied without concerns in most scenarios.
This tool ensures confidence in your optimizations and helps you decide which API to use when multiple approaches are available.
What is more, with a proper CI/CD pipeline you may incorporate performance testing and track the performance of your app with every release or even with every PR merged, so performance degradation of your most critical systems or hot paths is not a surprise for you.
I found performance testing exceptionally helpful considering the substantial role of code generation in Unity.Entities and the complexity of the API.
Measuring performance in Unity ECS systems, especially those using the job system, comes with challenges. Despite these hurdles, my past posts (1, 2) consistently showed that performance tests with the job system remain reliable. They prove to be a decent tool, effectively covering the majority of Unity use cases.
This tool ensures optimized performance and guides you in choosing the right API approach. Integrating it into a well-structured CI/CD pipeline allows seamless performance testing with each release or PR merge, so performance degradation of your most critical systems or hot paths is not a surprise for you.
Based on these foundational benefits, here are a couple of key takeaways:
- Confident Decision-Making: Performance tests add confidence in choosing the right API approach, especially when faced with multiple options. This ensures that your chosen methods perform better in your particular use case.
- Continuous Performance Tracking: Establishing a proper CI/CD pipeline allows streamlining performance testing which also enables ongoing monitoring of your application’s performance. This is crucial for identifying and addressing any unexpected issues as they arise.
- Mitigating Code Evolution Challenges: Unity.Entities, with their ever-evolving API, can pose challenges for developers. Performance testing allows you to adapt and optimize your code based on real-world performance metrics.

Alexey Merzlikin
Experienced game developer and tech lead with a passion for writing educational content about game development and programming. I have over 10 years of industry experience focused on performance optimization, clean code practices, and robust game architecture. I share regular posts on my Telegram channel about applying software engineering best practices to build high-quality games. My goal is to help other game developers level up their skills.
Leave a Reply