Sampling vs. Instrumentation Profilers in Unity: When to Use Each for Better Performance
I decided to write this after I saw a new post on Profiling in Unity using Superluminal.
I first came across this tool about two years ago when Unity was reviewing one of our projects. They were also investigating why the editor was running so slowly with our massive project, and Superluminal was one of the tools they used. Ngl, I haven’t touched it since.
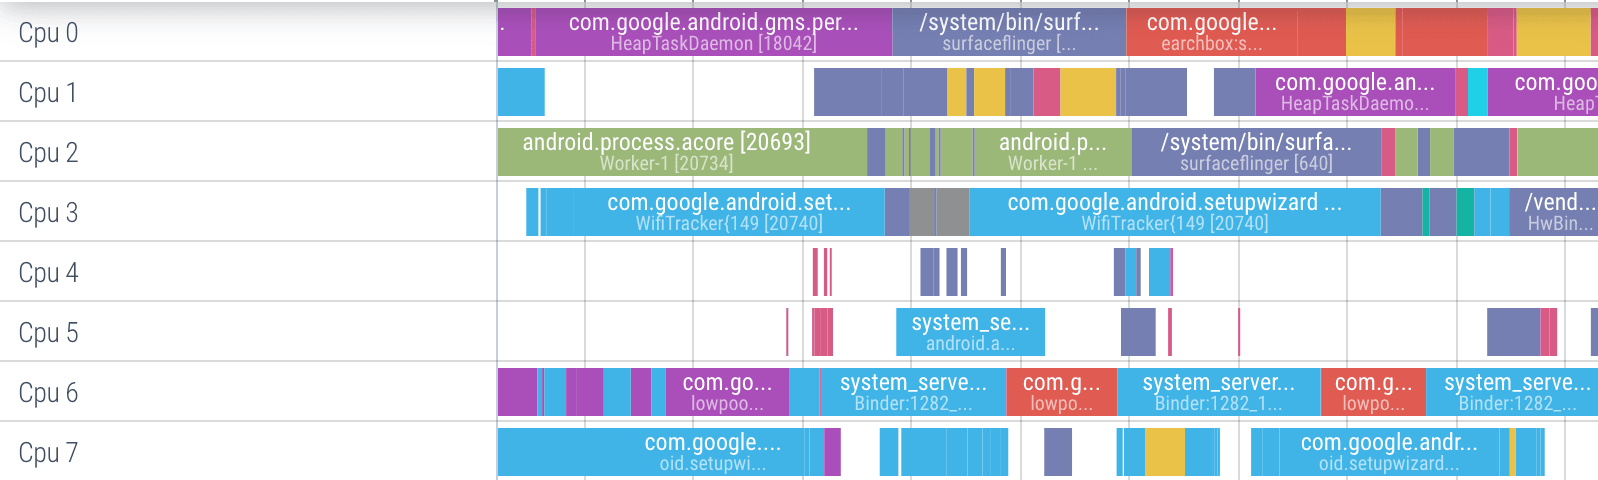
When it comes to other sampling profilers, I used System Trace View from Android Studio Profiler instead, as I had to profile Android builds of our Unity game. While it gave me insights into cold and hot app starts, I wouldn’t say it was a pleasant experience.
What I had a much better experience with were custom sampling tools that helped detect and improve many performance issues across multiple Unity projects.
Lately, I keep seeing Superluminal mentioned online more and gaining popularity, so it might be a good time to check it out again.
It is not a replacement for Unity Profiler, though. Unity’s profiler is instrumentation-based, while Superluminal is sampling-based. Let’s see what’s the difference
Sampling vs. Instrumentation Profilers: Unity Profiler and Superluminal
The key difference between Instrumentation and sampling profilers lies in how they collect performance data.
Instrumentation Profilers (e.g., Unity Profiler)
- How they work: Insert code (hooks/callbacks) directly into your application at function entry/exit points
- Data collection: Records the exact timing of every function call
- Accuracy: Provides precise timing information and exact call counts
- Overhead: Generally higher overhead as instrumentation code executes with each function call
- Unity Profiler example: Instruments your Unity code to track exact method execution times, memory allocations, and rendering statistics
Sampling Profilers (e.g., Superluminal)
- How they work: Periodically “sample” the program’s call stack at regular intervals
- Data collection: Takes statistical snapshots of what code is executing at sampling moments
- Accuracy: Statistical approximation of time spent in functions; may miss very short function calls
- Overhead: Generally lower overhead as sampling happens independently of function execution
- Superluminal example: Captures stack traces at regular intervals to build a statistical view of performance hotspots with minimal impact on game performance
Both tools have their place in a performance optimization workflow, often being used together to get a complete picture of application performance.
My Experience Working With Sampling Profilers
Based on my experience sampling profilers help in the following cases:
- Identifies CPU hotspots – Shows which functions are consuming the most time during app startup, loading of various scenes like lobby and levels.
- Catches native (C++) and managed (.NET) code – Useful for both Unity engine internals and your own C# scripts.
- Analyzes multi-threading or asynchronous behavior – Helps detect if threads are stalling or waiting on I/O.
When To Use Sampling vs Instrumentation Profiler
So for me, here is a general rule for when to use each profiler:
✅ If you have a long loading time → Use a sampling profiler (Superluminal, VTune, etc.) to find out which functions take the most time during startup. This helps with optimizing file I/O, asset loading, and CPU-bound initialization.
✅ If you have freezes or stutters during gameplay → Use Unity Profiler to track spikes in CPU, rendering, or garbage collection. It helps identify slow scripts, excessive allocations, and frame drops.
That said, if the freeze happens during loading, you might still want to use a sampling profiler to check if an async flow is being blocked (e.g., waiting for I/O or another thread to finish).
Unity Deep Profiler Issues
Another problem with Unity Profiler is that deep profiling may skew performance results due to how it works with deep call stacks. When you enable Deep Profiling in Unity Profiler, it instruments every single function call in your code, not just the high-level Unity callbacks.
This creates several issues:
- Overhead: Each function entry and exit requires code execution to record timestamps, which dramatically slows down your game.
- Altered performance characteristics: The profiling overhead isn’t distributed evenly. Functions that are called frequently or nested deeply in call stacks will appear disproportionately expensive compared to their actual runtime cost.
- Statistical distortion: The relative timing between different systems becomes skewed. A system with many small function calls might appear to take more time than it actually does in a non-profiled build.
- Memory pressure: Recording all this data increases memory usage, which can trigger additional garbage collection, further distorting results.
So my plan in such cases is as follows:
- First, I use a sampling profiler like Superluminal to identify hotspots with minimal performance impact.
- Then, I place manual profiling markers only around suspected problematic code.
- This targeted instrumentation provides precise timing data exactly where needed, avoiding the massive overhead of instrumenting everything.
This hybrid approach gives you the best of both worlds: the low overhead of sampling profilers for discovery, and the precision of instrumentation only where it matters.
Custom Profilers
I have also seen many times how experienced teams introduce their own sampling solutions based on custom markers or logs. This data is then presented via a custom editor tool, HTML, or Chrome Tracing/Perfetto. While these tools are tailored for the project and its features, it takes time to implement and teach the team to use them, whereas Superluminal is learned once and can be used on any project, even legacy ones.
So, it is definitely a viable alternative, but you must make an informed decision before implementing and integrating it. I must admit that some architectures are prone to supporting such tooling and allow for quick integration if you have infrastructural code where you can add your markers and cover the whole project immediately. For example, an HMVC architecture I gave a talk about a while ago.
Conclusion
Both sampling and instrumental profilers have their place, and picking the right one depends on what you’re trying to profile. Unity Profiler gives precise timing data but adds overhead, so it’s great for tracking frame drops, GC spikes, and slow scripts. Sampling profilers like Superluminal are better for finding CPU hotspots, analyzing multi-threading and async operations, and debugging long load times without slowing everything down.
For me, the best approach is a mix of both. Custom profiling solutions can work too, but they take time to build and teach. Meanwhile, Superluminal is ready to go and works even on legacy projects.
If you’ve used Superluminal or any other sampling profiler and got cool results, let me know — I’d love to hear how you made it work for you!

Alexey Merzlikin
Experienced game developer and tech lead with a passion for writing educational content about game development and programming. I have over 10 years of industry experience focused on performance optimization, clean code practices, and robust game architecture. I share regular posts on my Telegram channel about applying software engineering best practices to build high-quality games. My goal is to help other game developers level up their skills.
Leave a Reply